
Baseball coaches, players, and fans worship stats — whether it’s Pete Rose’s 4,256 career hits, Nolan Ryan’s 5,714 strikeouts, or Ty Cobb’s .367 career batting average. But in recent years, statistics have become increasingly important tools used to analyze players’ performance fielding, batting, and, most importantly, pitching. Front offices around Major League Baseball use a number-crunching tool called sabermetrics, a term coined by baseball writer Bill James that references the Society for American Baseball Research (SABR), an institution based at the Arizona State University’s Walter Cronkite School of Journalism and Mass Communication. The society’s original mission was to encourage the research and curation of baseball history, but now it’s the boss of baseball stats. Sabermetrics entered popular culture courtesy of Moneyball, a film about the Oakland Athletics baseball team’s turn to a sabermetric approach to building a winning team of undervalued players. Now sabermetrics are a regular fixture in media coverage of the sport and a necessity for every fan to grasp.
Why is studying sabermetrics so crucial for coaches and pitching scouts? The stat nerds at SABR give us an example. “Knowing that there is a predictable relationship between a batting line and runs is useful when we don’t know how many runs we actually have,” according to SABR. These metrics give us a predictable scientific value to work with when determining how we expect a pitcher to perform.
Jacob Pomrenke, director of editorial content for SABR, points out that sabermetrics may be difficult to judge in October, but they are a valuable tool or predictor of how pitchers may perform in the playoffs. “There are so few games played, that it’s difficult to make that determination,” he says. “If a pitcher makes one small mistake, his stats will become inflated.”
Andy Andres, a Boston University professor of Natural Sciences & Mathematics who teaches a course on sabermetrics, suggests looking for trends that suggest a player is improving overall, and specifically improving on their fastball velocity. “There is no magic sabermetric statistic indicator about who is going to crush it in the playoffs,” Andres says. “It is based on the talent of who has been performing well all along, and the best are those that get the most ‘swings and misses.’”
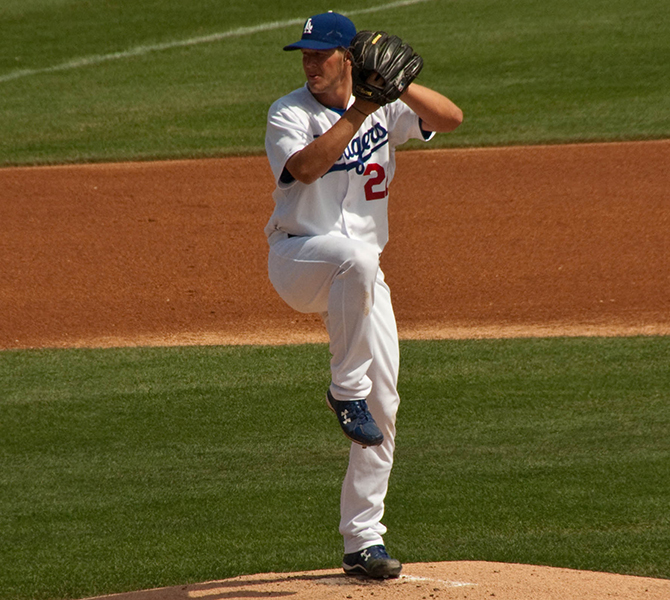
An anomaly to that reasoning is Dodgers pitcher Clayton Kershaw. The three-time National League Cy Young award winner had the best ERA, WHIP and K/BB ratio in the regular season in 2015, but the postseason became his kryptonite. The number one pitcher in the game just couldn’t put it together in terms of wins and losses when the lights are at their brightest in mid-fall. “Kershaw has all the statistics you look for — high strikeout rate and low walk rate,” says Andres. “He is still dominant in the playoffs, but the sample size is too small in the post season. His win/loss record isn’t the whole indicator. He is the same guy, still dominant, and we just haven’t seen enough of him in the playoffs.”
And that’s why a pitcher’s regular season statistics provide a clearer picture thanks to 162 games worth of data, as opposed to the maximum 20 games in the playoffs. In 2016, there are some pitchers who could find success in the postseason based on previous postseason performances as well as their regular season numbers. For example, New York Mets pitcher Noah Syndergaard. Last year, he was the only pitcher to win a game against the Royals in the 2015 World Series. His 2015 ERA was a little high at 3.24, but he struck out 166 in 150 innings.
Or Chicago Cubs star pitcher, Jake Arrieta who was the 2015 NL Cy Young winner, won 22 games last year, posted a 1.77 ERA, and struck out 236 in 229 innings. This April, he converted his second career no-hitter against the Reds in a 16-0 win. He performed well in the postseason, but fell in the National League Championship Series against the Mets.
Finally, there’s Boston Red Sox pitcher David Price. He showed promise early in the 2016 campaign, and overall delivered impressive numbers across the board. His 2.45 ERA last season, and combined 18 wins between the Blue Jays and the Tigers in 2015 is enough to consider him a possible ace if the Red Sox hope to maintain their prominence into September. However, he like Clayton Kershaw, has struggled in the postseason’s records column.
Stat Star Pitchers of 2015


If you want to join the number-crunching game, Pomrenke and Andres suggest you start with the five most important metrics for evaluating pitchers.
ERA: Earned run average, or the average number of runs a pitcher earns per nine innings pitched. It’s always a pitcher’s job to put up zeroes for his batters, so keeping the runs at bay will give the team a better chance to win, especially if the run support is anemic.
ERA+: Used to determine a pitcher’s ERA compared to the rest of the league average. A percentage, for example, as referenced by Patriot on Walk Like a SABR Metrical. “A common way to explain ERA+ figures in English is to say that an ERA+ of 1.07 means a pitcher is ‘7% better than average’, or an ERA+ of .84 means that he is ‘16% worse than average.’” The grammar is what causes people to get this stat easily confused in their explanation. Saying someone’s ERA is worse than average makes it sound like they’re not doing too good of a job, but the confusion is in using the word “worse” to be a synonym for “lower.” Now, when you say a pitcher’s ERA is lower than average it sounds much better. This is how ERA+ gets confusing, but it provides another perspective to performance.
FIP: Andy Andres says FIP, or fielding independent pitching, is becoming a very crucial aspect of judging a pitcher’s performance. This formula is a bit more complicated, but gives a clearer picture of the pitcher, and thus is becoming more incorporated in pitchers’ stats. It eliminates the fielders from the equation, focusing only on the things pitchers have control over: homeruns, walks and strikeouts. “A pitcher’s FIP doesn’t match their ERA,” says Pomrenke. “It just adds more information to look at the player overall and see how they perform while eliminating any play’s that are not in their control.”
K/BB: Strikeout per walk ratio shows just what you would expect. The ability of a pitcher preventing a ball from going in-play is important particularly if the defense behind them is struggling. Now that we have moved past the steroids era, the strikeout reigns supreme. Obviously, preventing players from getting on base via walking is ideal as they force the pitcher to have to throw more pitches and exit the game sooner. “If you want something simple what I always try to use is just K/BB ratios,” Andres says. “It is a simple measurement. It really gets into the talent of a pitcher, the talents that really matter, the abilities to strike batters out and the ability to not walk batters”
OOPS: That’s not a mistake. There is even more in depth metrics to gauge today’s great hurlers. OOPS is opponent on-base plus slugging. In order to figure out OOPS, we have to figure out what OPS means, or on-base plus slugging. This is simply adding a batter’s on-base percentage (OBP) to their slugging average (SLG). On-base percentage (OBP) is the percentage of times a batter reaches a base not including a fielder’s error, fielder’s choice, or some other error such as catcher’s interference or dropped/uncaught third strike. Slugging (SLG) determines the power of a hitter, which calculates total bases reached divided by at bats, and does not include walks. Thus, OOPS calculates what the batter’s OPS is against a particular pitcher.
Additional reporting by Tim Ferguson.


